How to Use the CSC Zip Code Summarizer Dashboard
The AGOL CSC Summarizer Dashboard was created to show all Carnegie Science Center programs summarized by zipcode. This user document will describe how to use the dashboard functions.
See the bottom of this page for a video of an example user experience.
Dashboard Elements
The Dashboard consists of three panels:
- A statistics panel consisting of “Customers in Zip” number and two bar graphs
- A zip code panel
- A map panel
The statistics and zip code panels interact with the map panel so that the data shown on the left relates to the map extent (what you can see) on the right.
When you first open the dashboard, the map view is of the continental United States. Therefore, the statistics panel is a complete summary of all programs.
Statistics Panel
Customers in Zip refers to the total number of participants in either:
- the map frame as you pan and zoom if no zip codes are selected, or
- if zip codes are selected, the total number of participants in selected zip codes.
The Program bar graphs display a breakdown of participants by program types in either
- the map frame as you pan and zoom if no zip codes are selected, or
- if zip codes are selected, the program breakdown in the selected zip codes.
As the mouse is hovered over specific bars, the exact number of participants in that program type is displayed.
Zip Code Panel
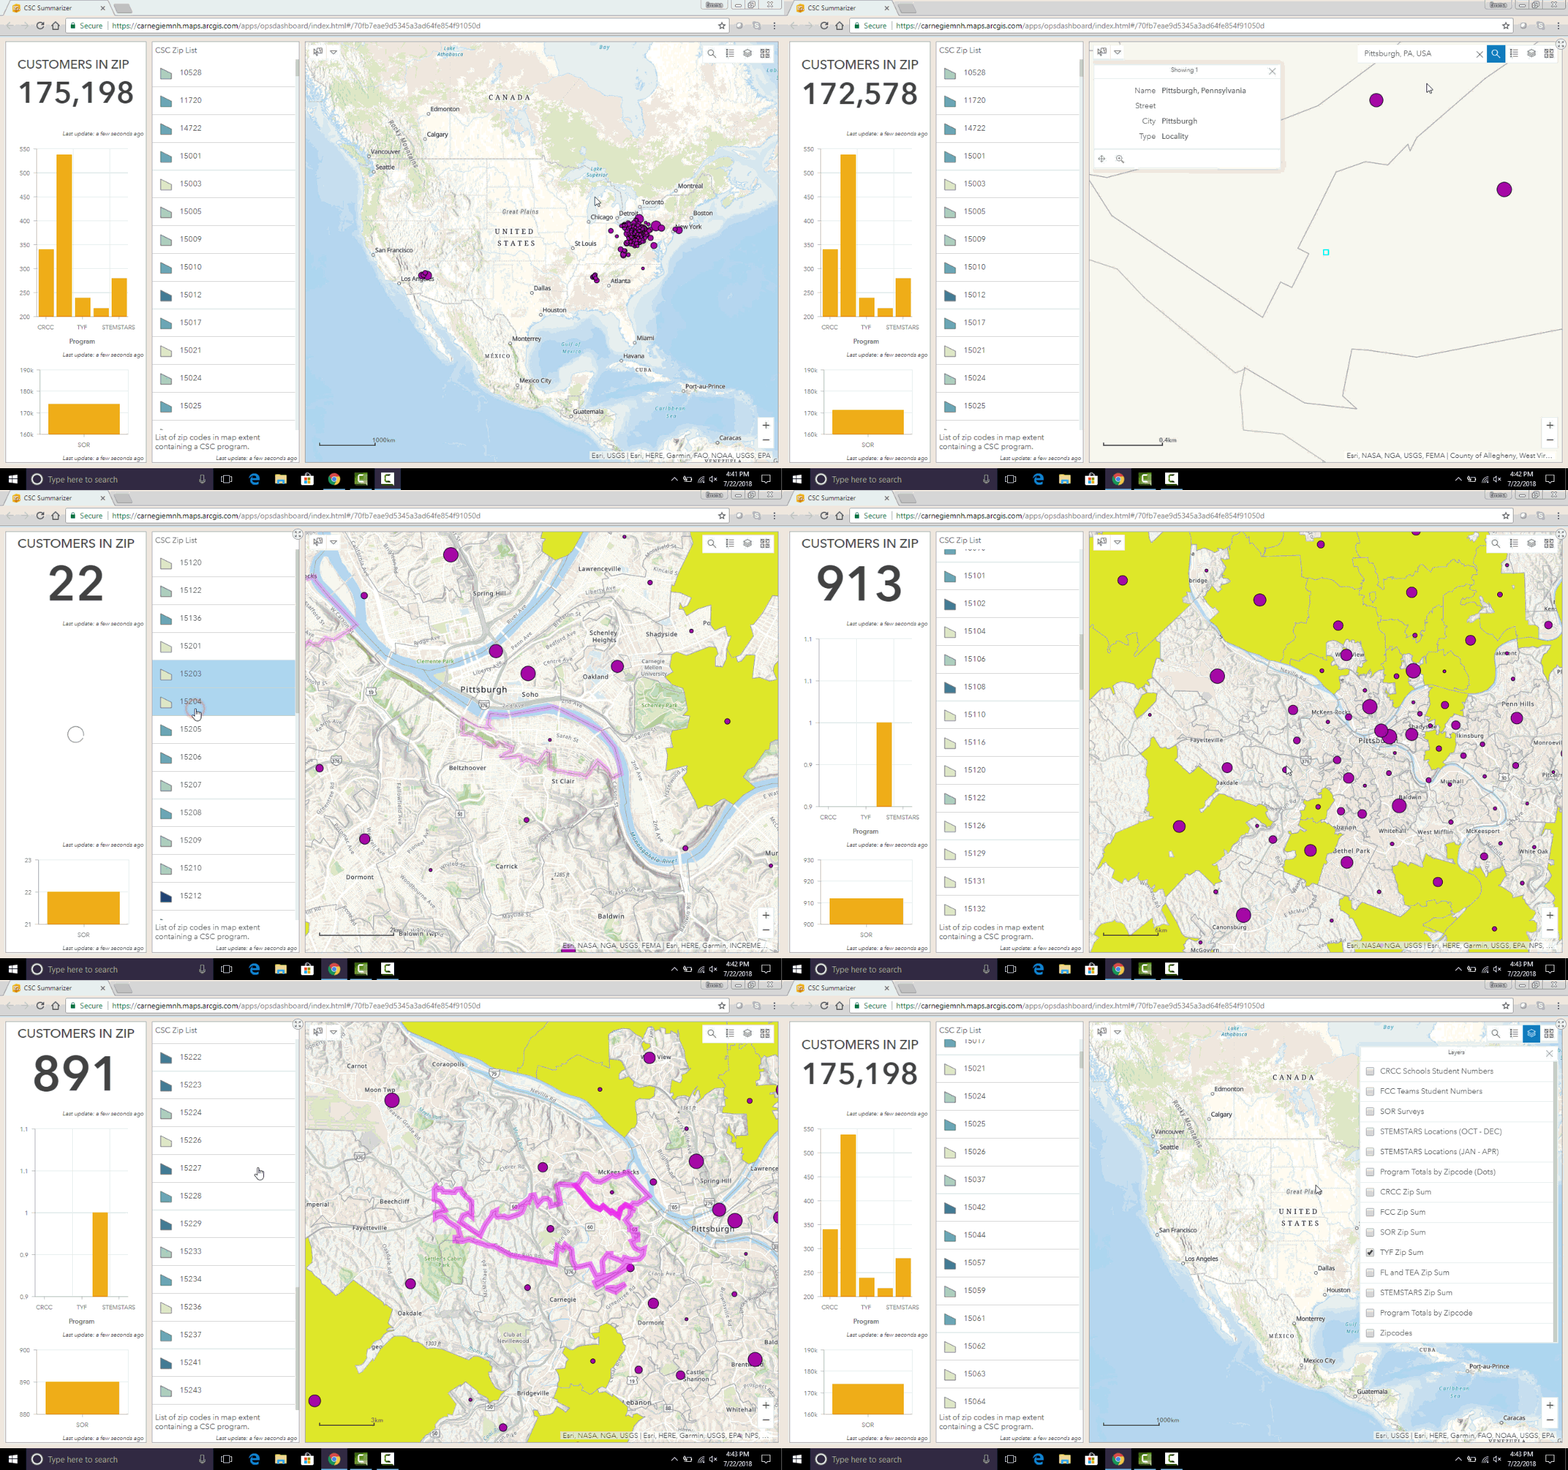
When panning and zooming in the map frame, listed zip codes in the CSC Zip List change to reflect those visible. Clicking on a listed zip code selects it and zooms to it in the map frame.
Map Panel
Video Showing how to Use Elements of the Map Panel

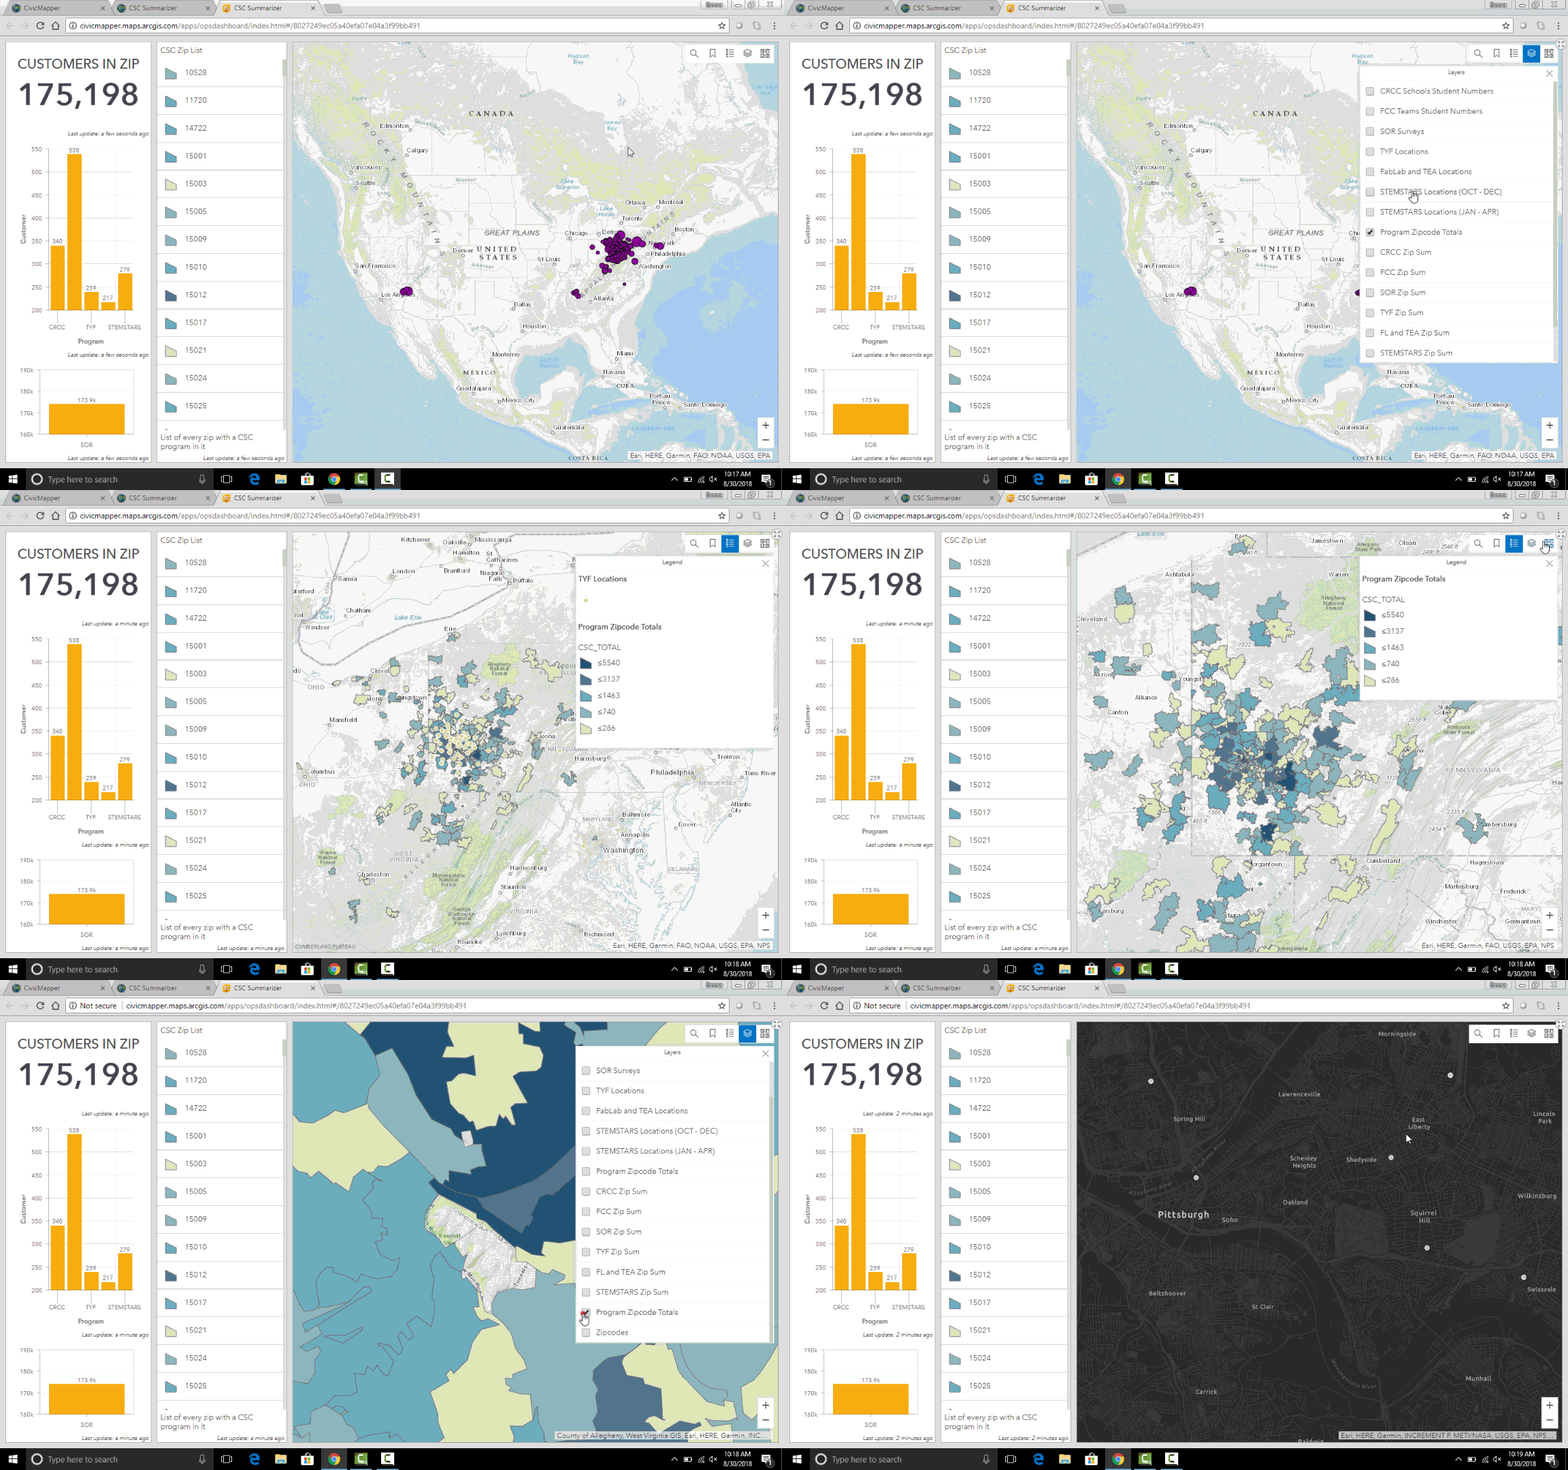
Geospatial data is displayed in the map panel. Widgets in the upper right hand corner of the panel allow the user to:
- search for a location,
- toggle the legend,
- toggle the table of contents where users can turn layers on and off,
- and choose alternative base maps.
Zoom buttons are located in the lower right hand corner, but a mouse wheel can also be used. Zoom in and out and pan the map to filter statistics and zip codes in the panels to the left.
Narrowing Data by Zip Code
Clicking a zip code in the CSC Zip List selects it. Several things then happen:
- A blue highlight appears on your selection in the list.
- The map panel zooms to your selected zip code and flashes a red highlight on the polygon.
- The numbers and graphs in the statistics panel change to reflect figures for the selected zip code.
Multiple zip codes can be selected at once by clicking more than one zip code. In this case the Statistics Panel will show graphs with combined figures for the selected zip codes. To deselect a zip code, click it again.
Narrowing Data by Location
Zooming in to a specific area will narrow the data displayed in the CSC Zip list and in the statistics graphs. Zoom in using the zoom buttons in the lower right hand corner of the Map Panel, or by using a mouse wheel.
Pan the map by clicking and dragging.
The magnifying glass in the upper right hand corner of the Map Panel can be used to search for and zoom to a specific set of coordinates, a city name, an intersection, a zip code, or other types of locations.
Demo
