Creating an ArcGIS Online Dashboard
Video Demonstration of Dashboard Creation

How to Create an ArcGIS Online Dashboard
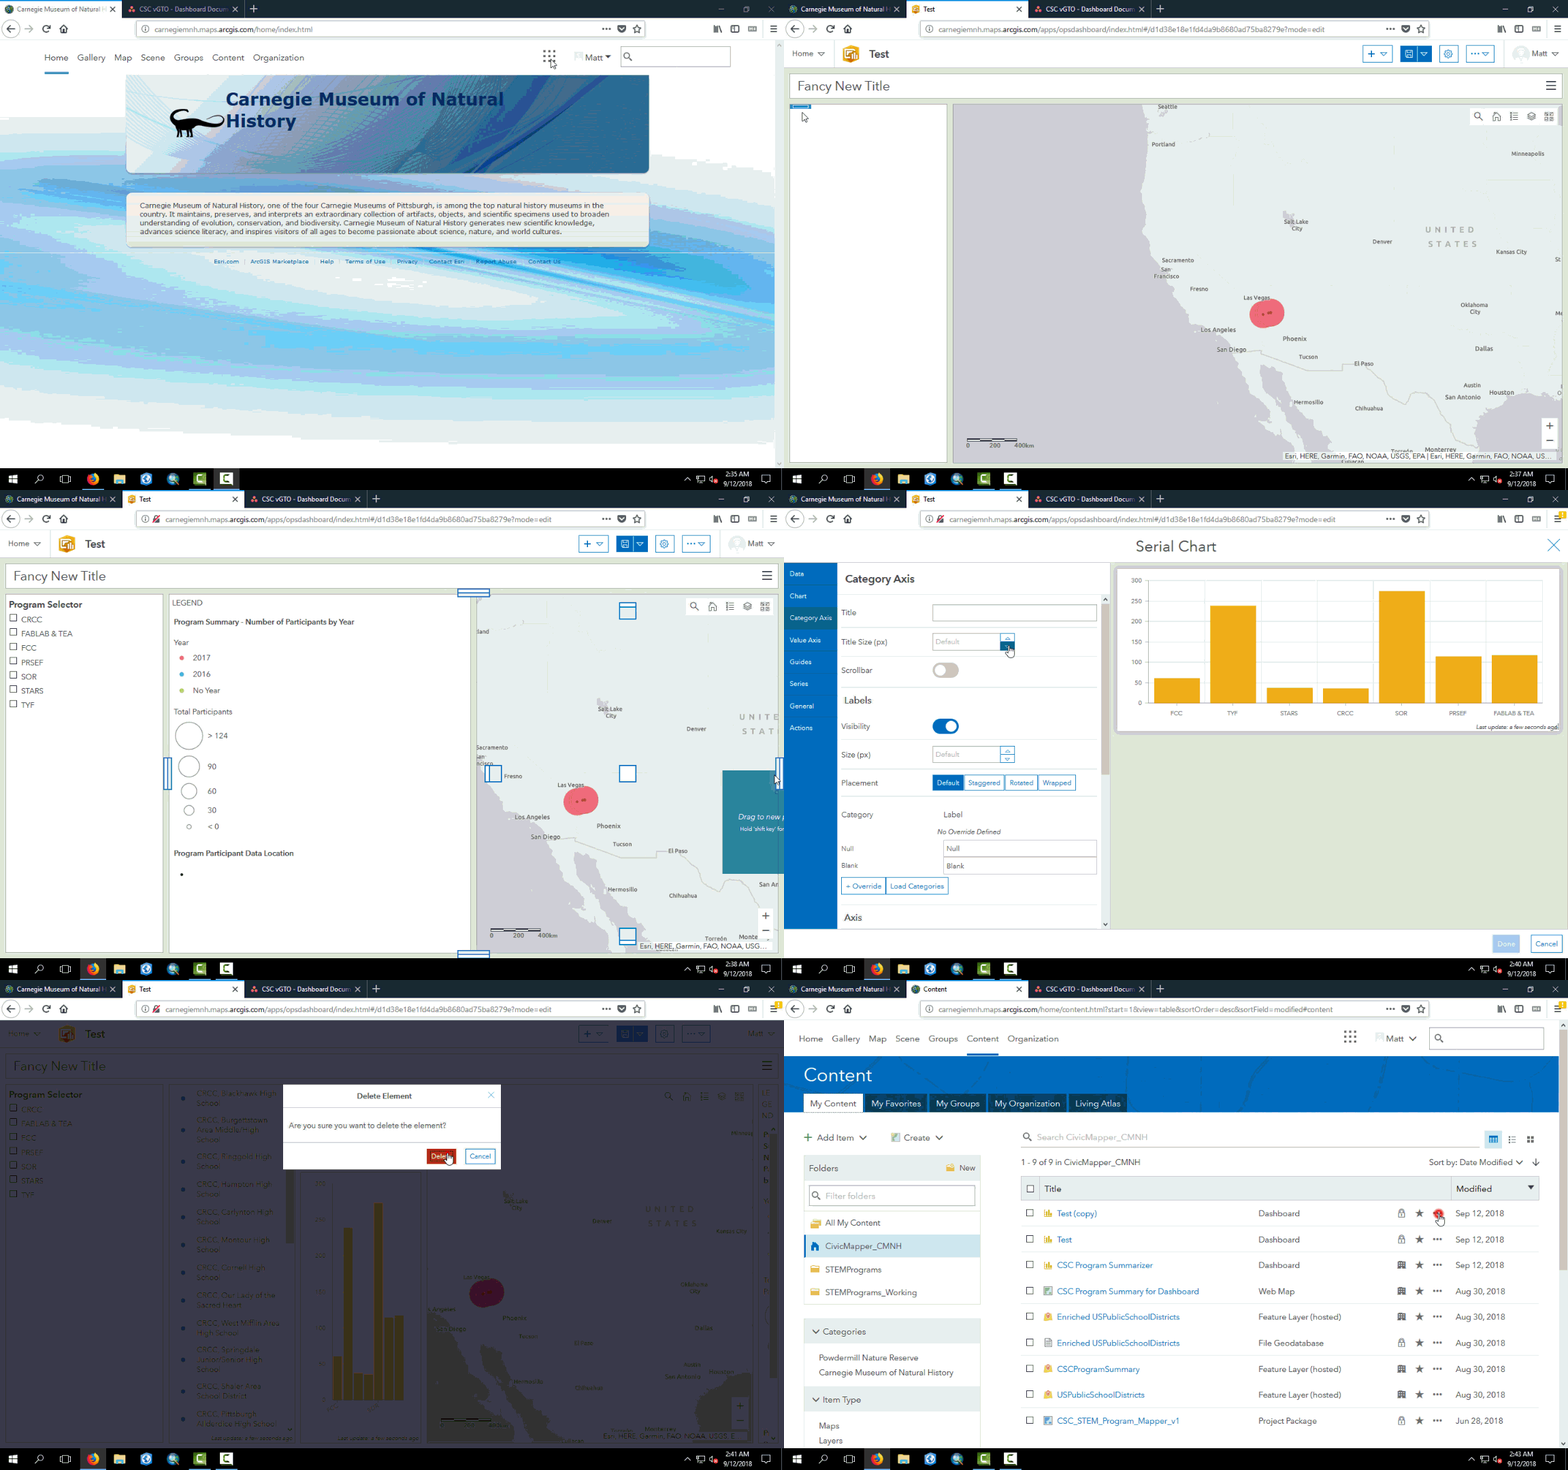
From the ArcGIS Online home page, click on the nine dots in the upper right hand corner of the screen. Select Operations Dashboard
Click Create Dashboard and Title and Tag your new dashboard.
To begin, click the Add Widget dropdown menu symbolized by a plus sign and choose Map
Select which web map your dashboard will be using.
Add other elements, for example a left hand panel with category filters, an indicator box, or a pie chart. Experiment with various elements as suits your needs. For more information about dashboards and elements visit the ESRI help page.
Elements can be customized to interact with map data and with one another. When creating a new element, there will be a field prompting you to choose which map layer the element will be pulling data from. Select the layer whose attributes hold the most valuable data and represent that data using the element you have chosen.
Elements interact with one another via actions. Once you have added some elements to your Dashboard, define their interactions by using the action tab in other elements.
- One example is to filter data in the other elements when the map extent changes. That way the dashboard will only be displaying data relevant to the map extent.
- Another example is to pan, zoom, or flash in the map element when a list element is selected.
Tip: Name elements with uniquely and specifically so that when you are designating actions you are not confused about which element to select.
Save your dashboard and share it with the public, your groups, or your organization from the content detail page.